JAMB Mathematics 2007 Past Questions & Answers
49 JAMB Mathematics 2007 questions with verified answers and worked explanations. Here are the first 10 — sign up free to practise the full paper.
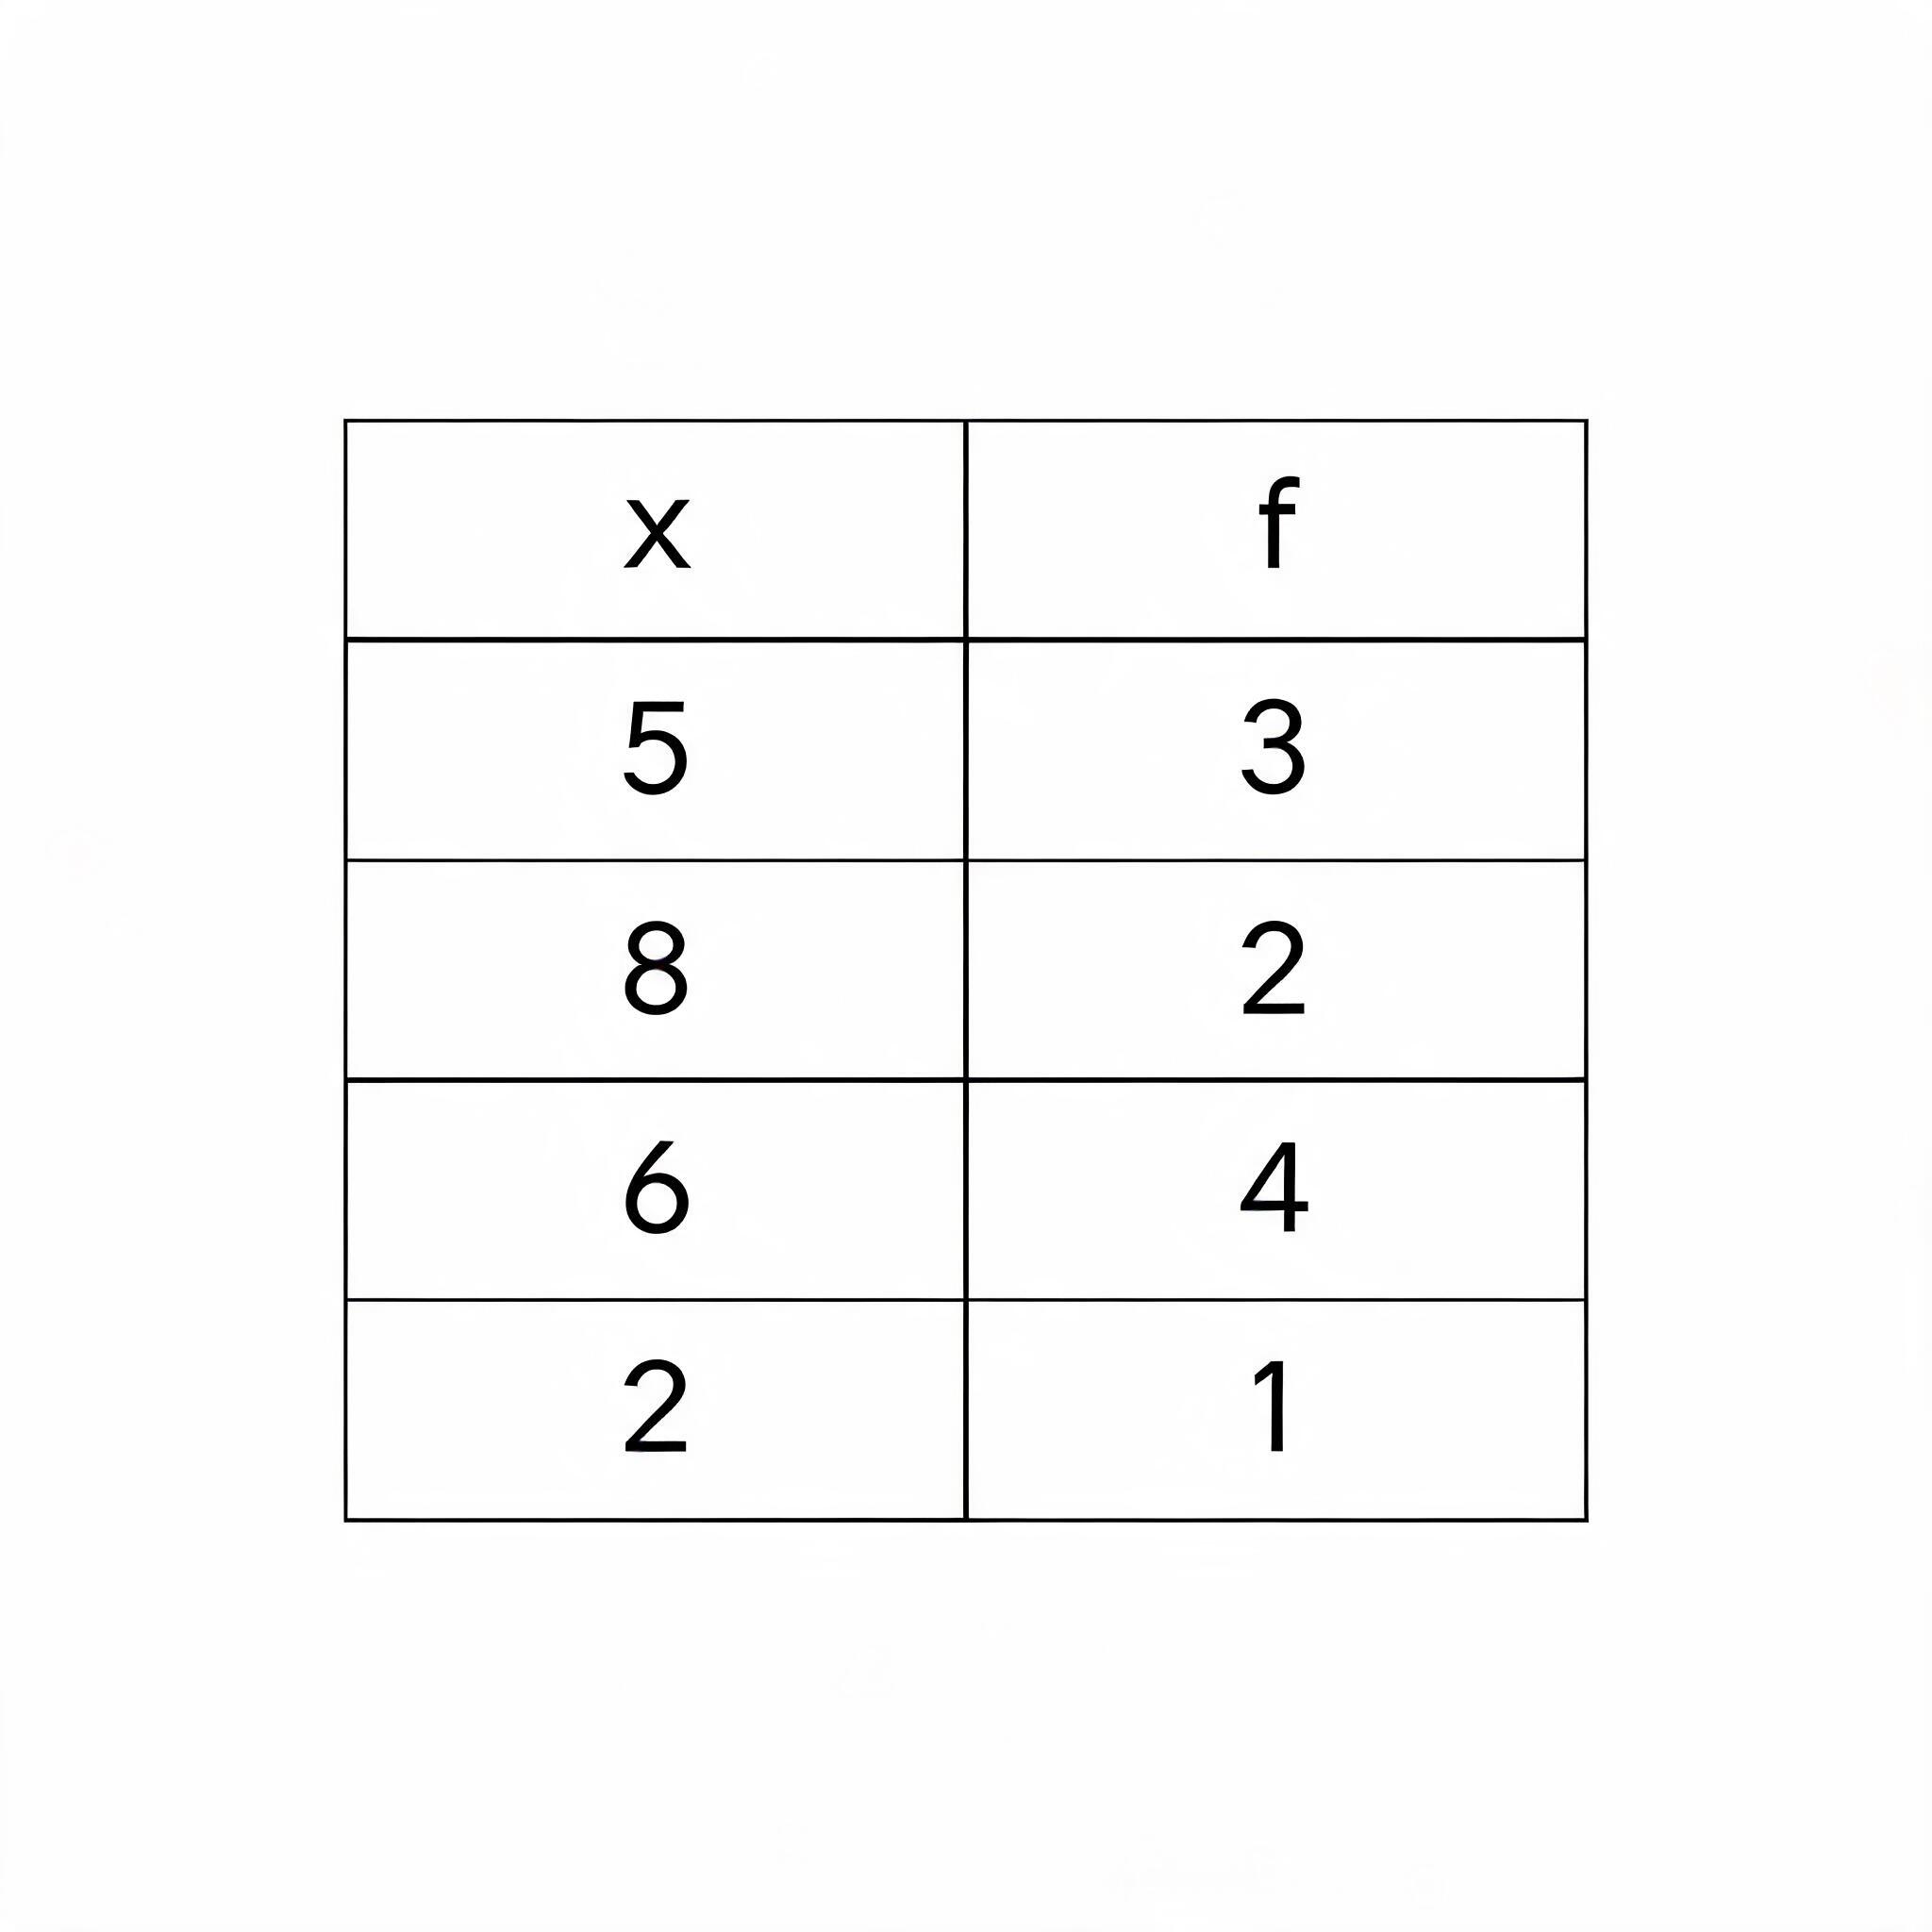
If 5, 8, 6 and 2 occur with frequencies 3, 2, 4 and 1 respectively. Find the product of the modal and the median number
- A.36
- B.48
- C.30
- D.40
First, find the modal number, which is the number with the highest frequency. From the table, the number 6 has the highest frequency of 4, so the mode is 6. Next, find the median by finding the middle number; the total frequency is = 10, so the median is the average of the 5th and 6th numbers in the ordered list (2, 5, 5, 5, 6, 6, 6, 6, 8, 8), which is = 6. Finally, the product of the modal number (6) and the median number (6) is 6 x 6 = 36.
Common mistake: Students might mistakenly choose 5 as the mode because it has a high frequency of 3, leading to an incorrect product of 5 x 6 = 30 (Option C).
In a basket, there are 6 grapes, 11 bananas and 13 oranges. If one fruit is chosen at random. What is the probability that the fruit is either a grape or a banana
- A.
- B.
- C.
- D.
First, calculate the total number of fruits in the basket, which is 6 + 11 + 13 = 30. The question asks for the probability of picking either a grape OR a banana, so we add the number of grapes and bananas to get the number of favourable outcomes: 6 + 11 = 17. Probability is the number of favourable outcomes divided by the total number of outcomes, so the answer is .
Common mistake: A common mistake is to calculate the probability for only one fruit, like just grapes or just bananas , forgetting that the word 'or' means you should add the possibilities.
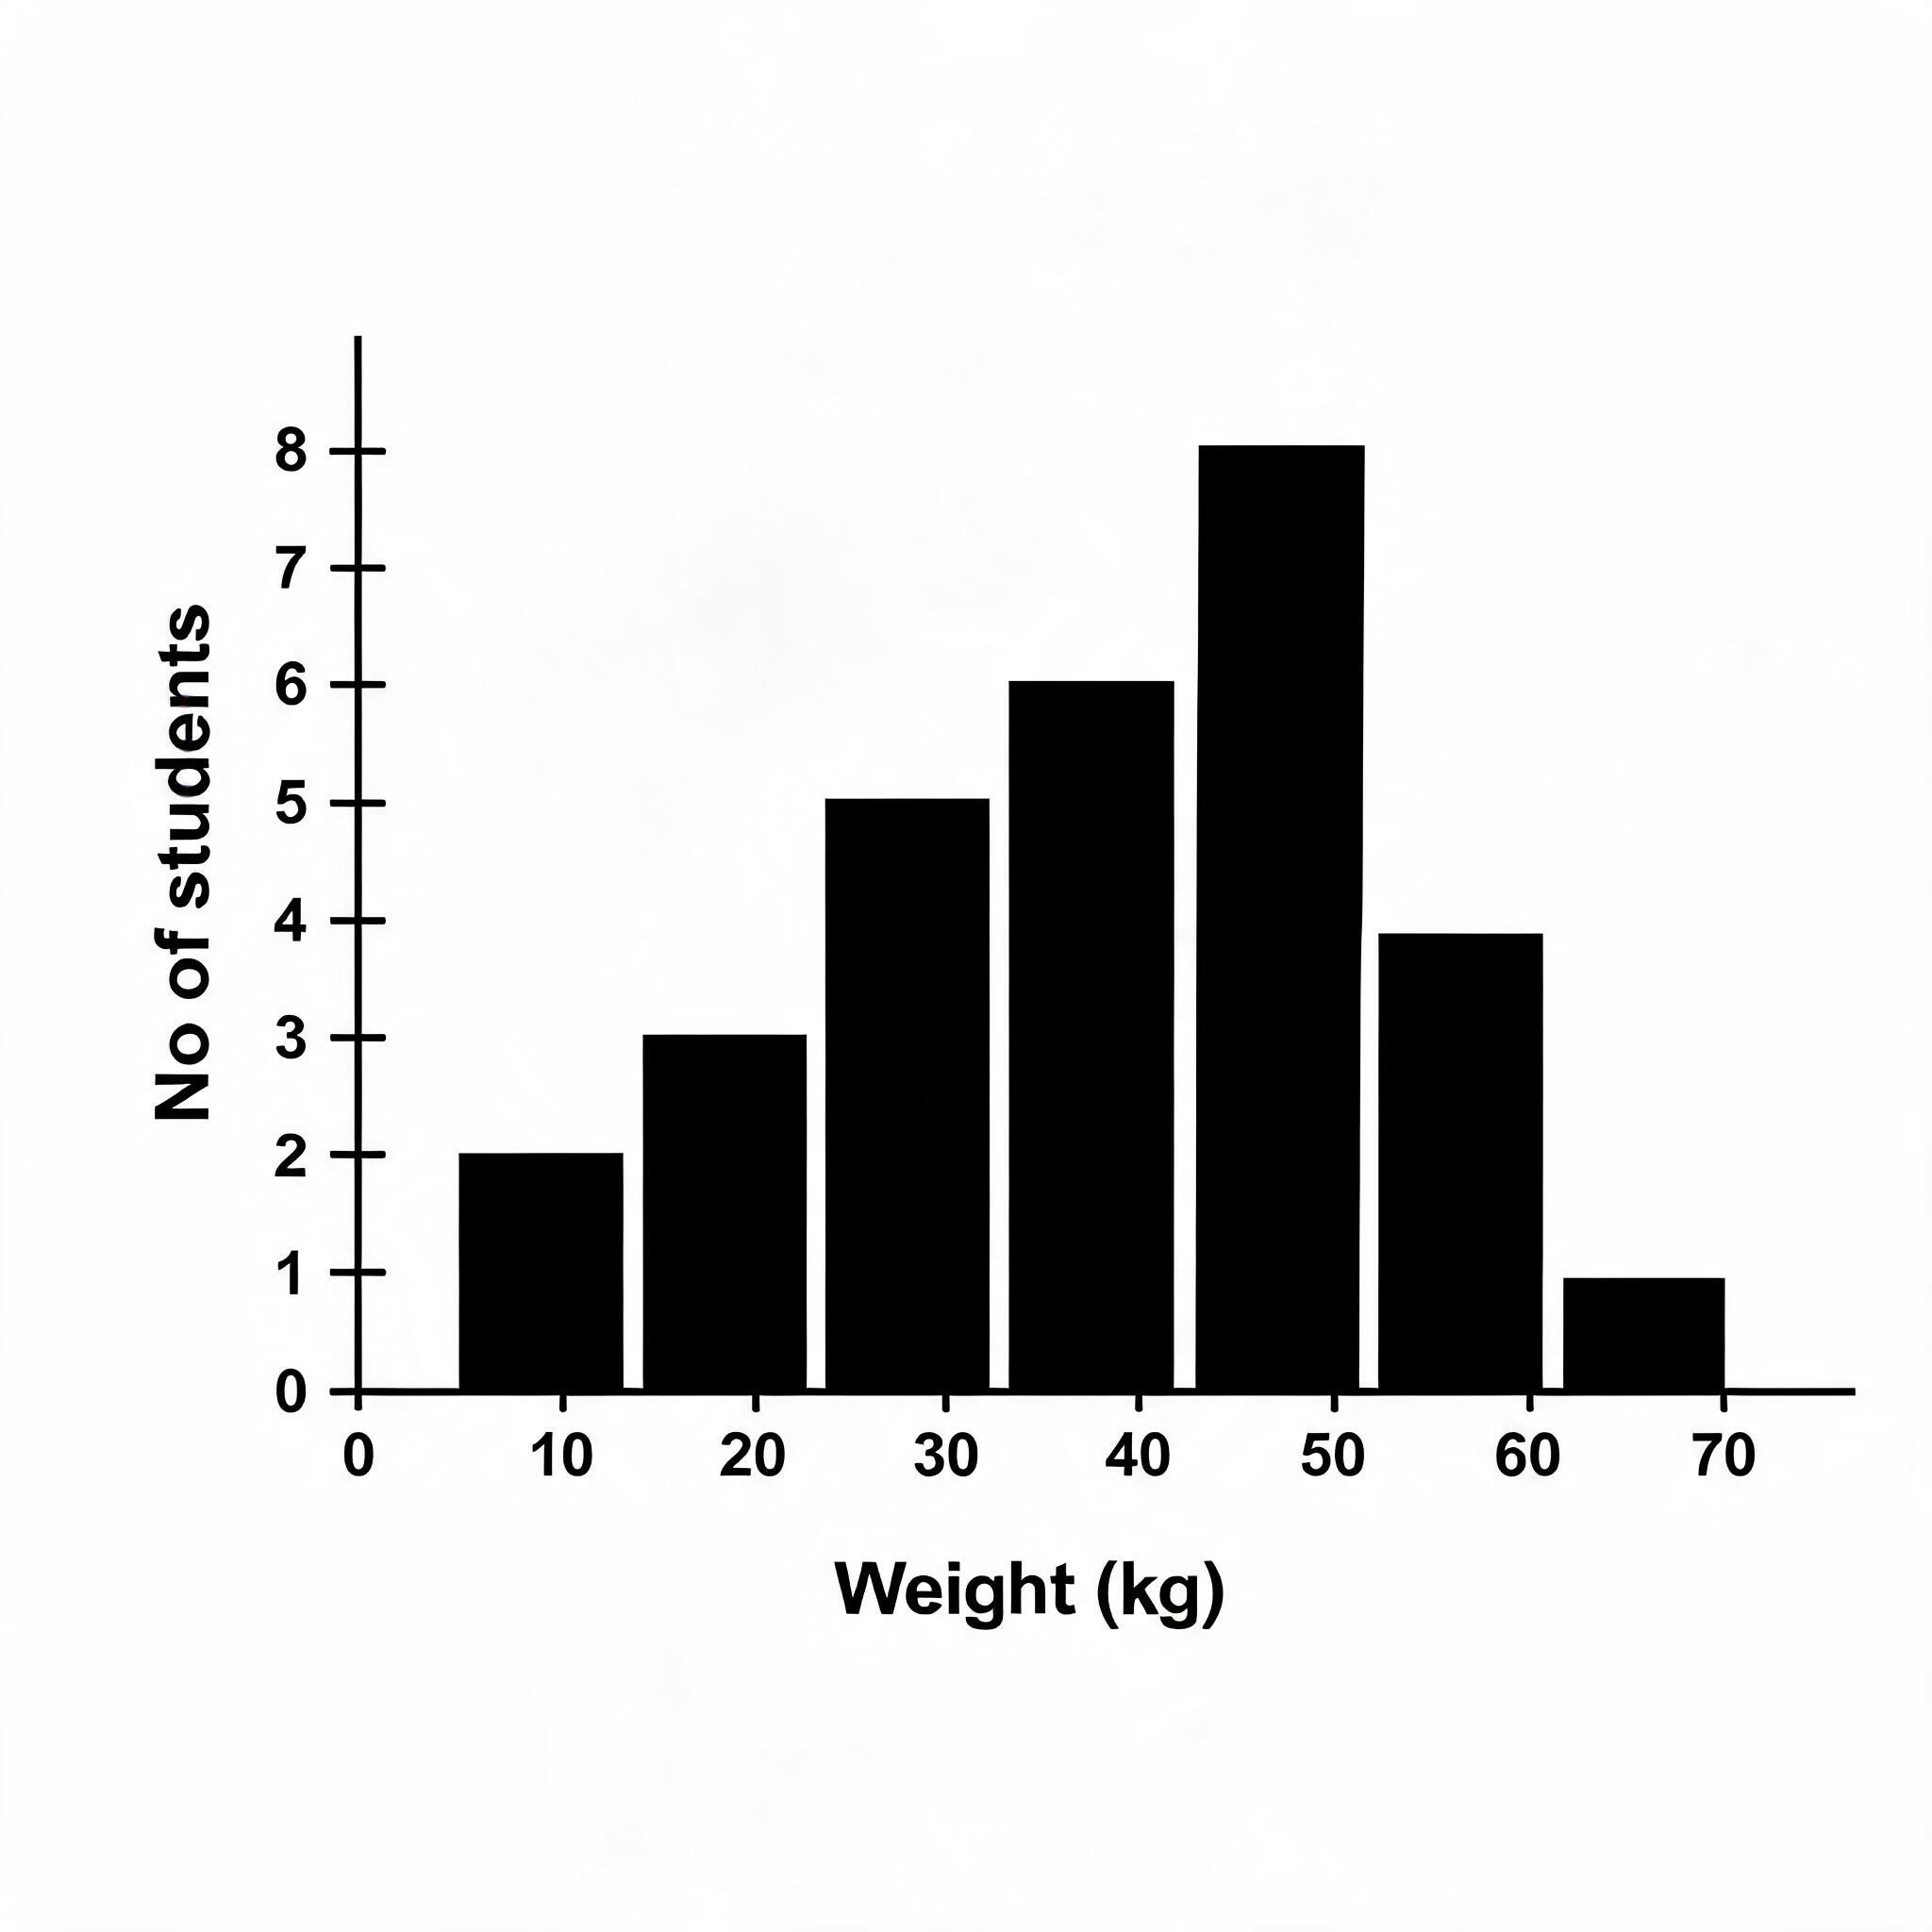
The histogram above represents the weights of students who travelled out to their school for an examination. How many people made the trip?
- A.78
- B.38
- C.29
- D.69
The question asks for the total number of people who made the trip, which is the total number of students represented in the histogram. To find this, we must sum the frequencies (number of students) for each bar. The frequencies for each weight group are 2, 3, 5, 6, 8, 4, and 1. Adding these numbers together gives the total: 2 + 3 + 5 + 6 + 8 + 4 + 1 = 29.
Common mistake: A common mistake is to misread the height of one or more bars from the y-axis or to make a simple error while adding the frequencies together.
A senatorial candidate had planned to visit seven cities prior to a primary election. However, he could only visit four of the cities. How many different itineraries could be considered?
- A.640
- B.840
- C.520
- D.920
This question asks for the number of different 'itineraries', which means the order in which the cities are visited matters, making it a permutation problem. We need to find the number of ways to arrange 4 cities chosen from 7 available cities. This is calculated as ⁷P₄ = 7! / ! = 7 x 6 x 5 x 4, which equals 840.
Common mistake: A common mistake is to treat this as a combination problem, forgetting that an 'itinerary' implies the order of the cities visited is important, which requires a permutation calculation.
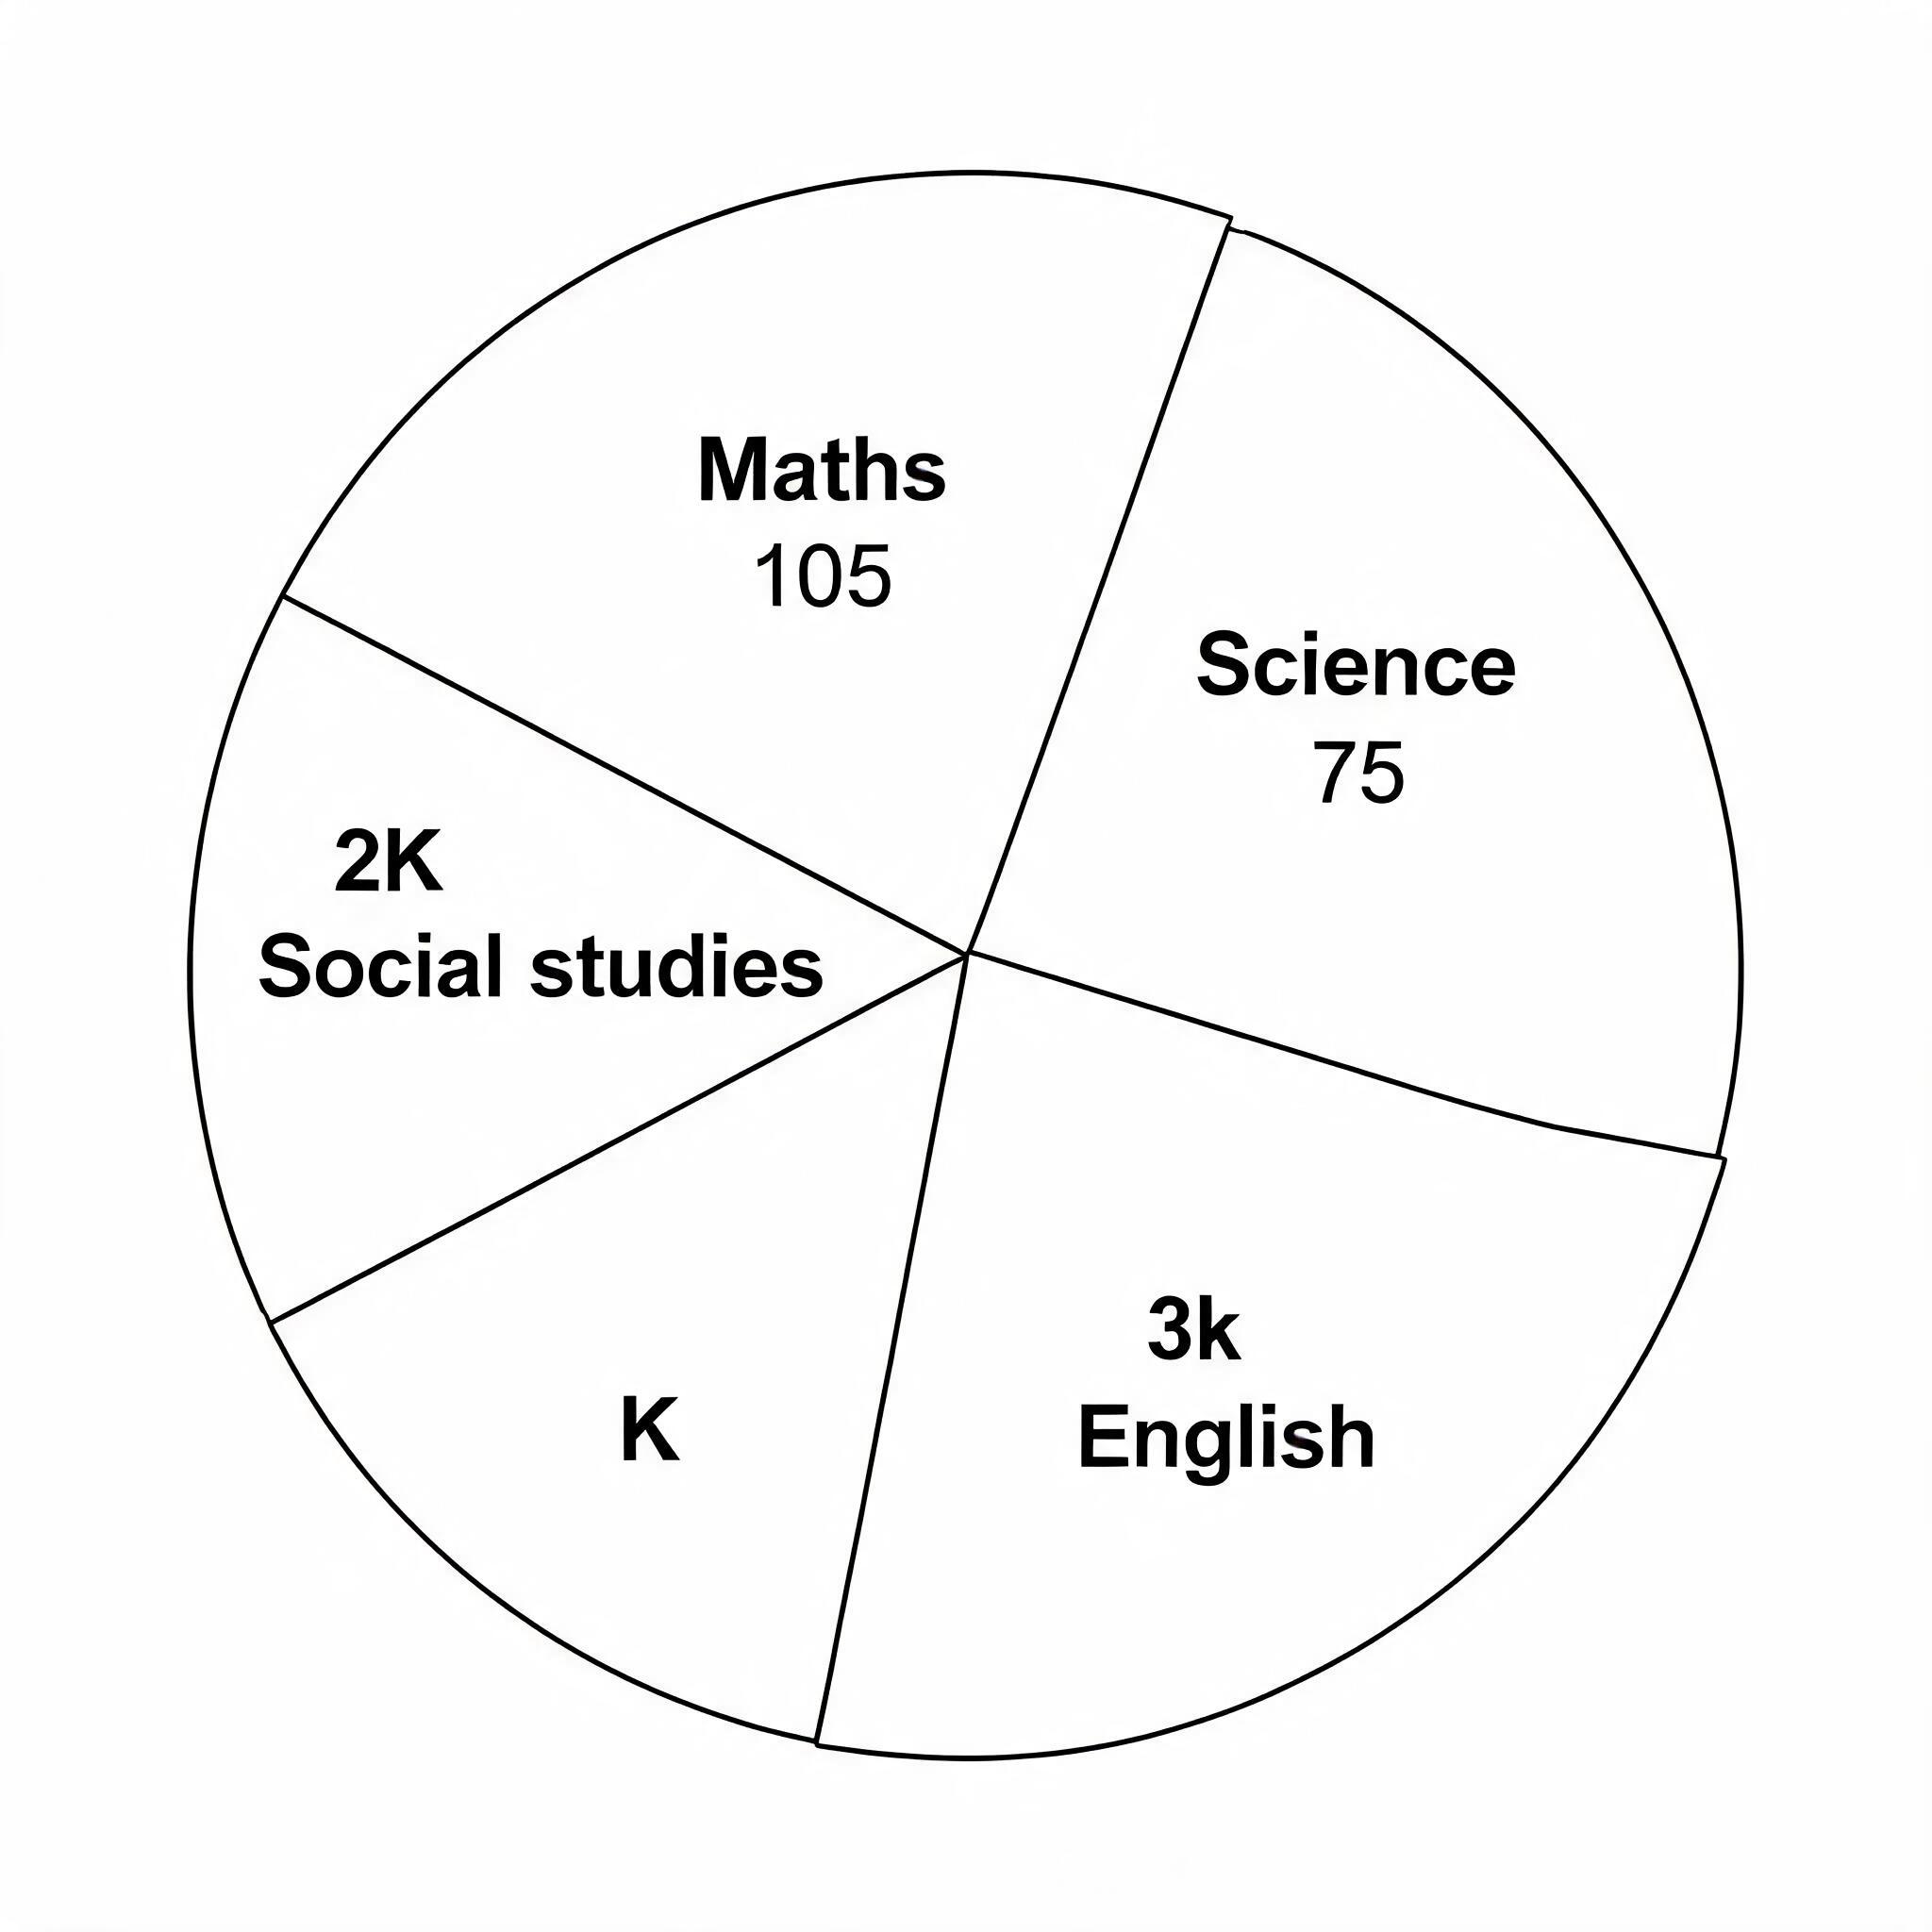
The pie chart above illustrate the amount of private time a student spends in a week studying various subjects. Find the value of k
- A.90°
- B.60°
- C.30°
- D.40°
A pie chart represents a whole, and the sum of all the angles at the center of a circle is 360 degrees. To find the value of k, we must add all the sectoral angles and equate them to 360°. This gives the equation: 105 + 75 + 2k + k + 3k = 360. Simplifying this, we get 180 + 6k = 360, which leads to 6k = 180, and therefore k = 30°.
Common mistake: A common mistake is to ignore the constant values (105 and 75) and incorrectly set the sum of the variable terms (6k) equal to 360, leading to the wrong answer of 60°.
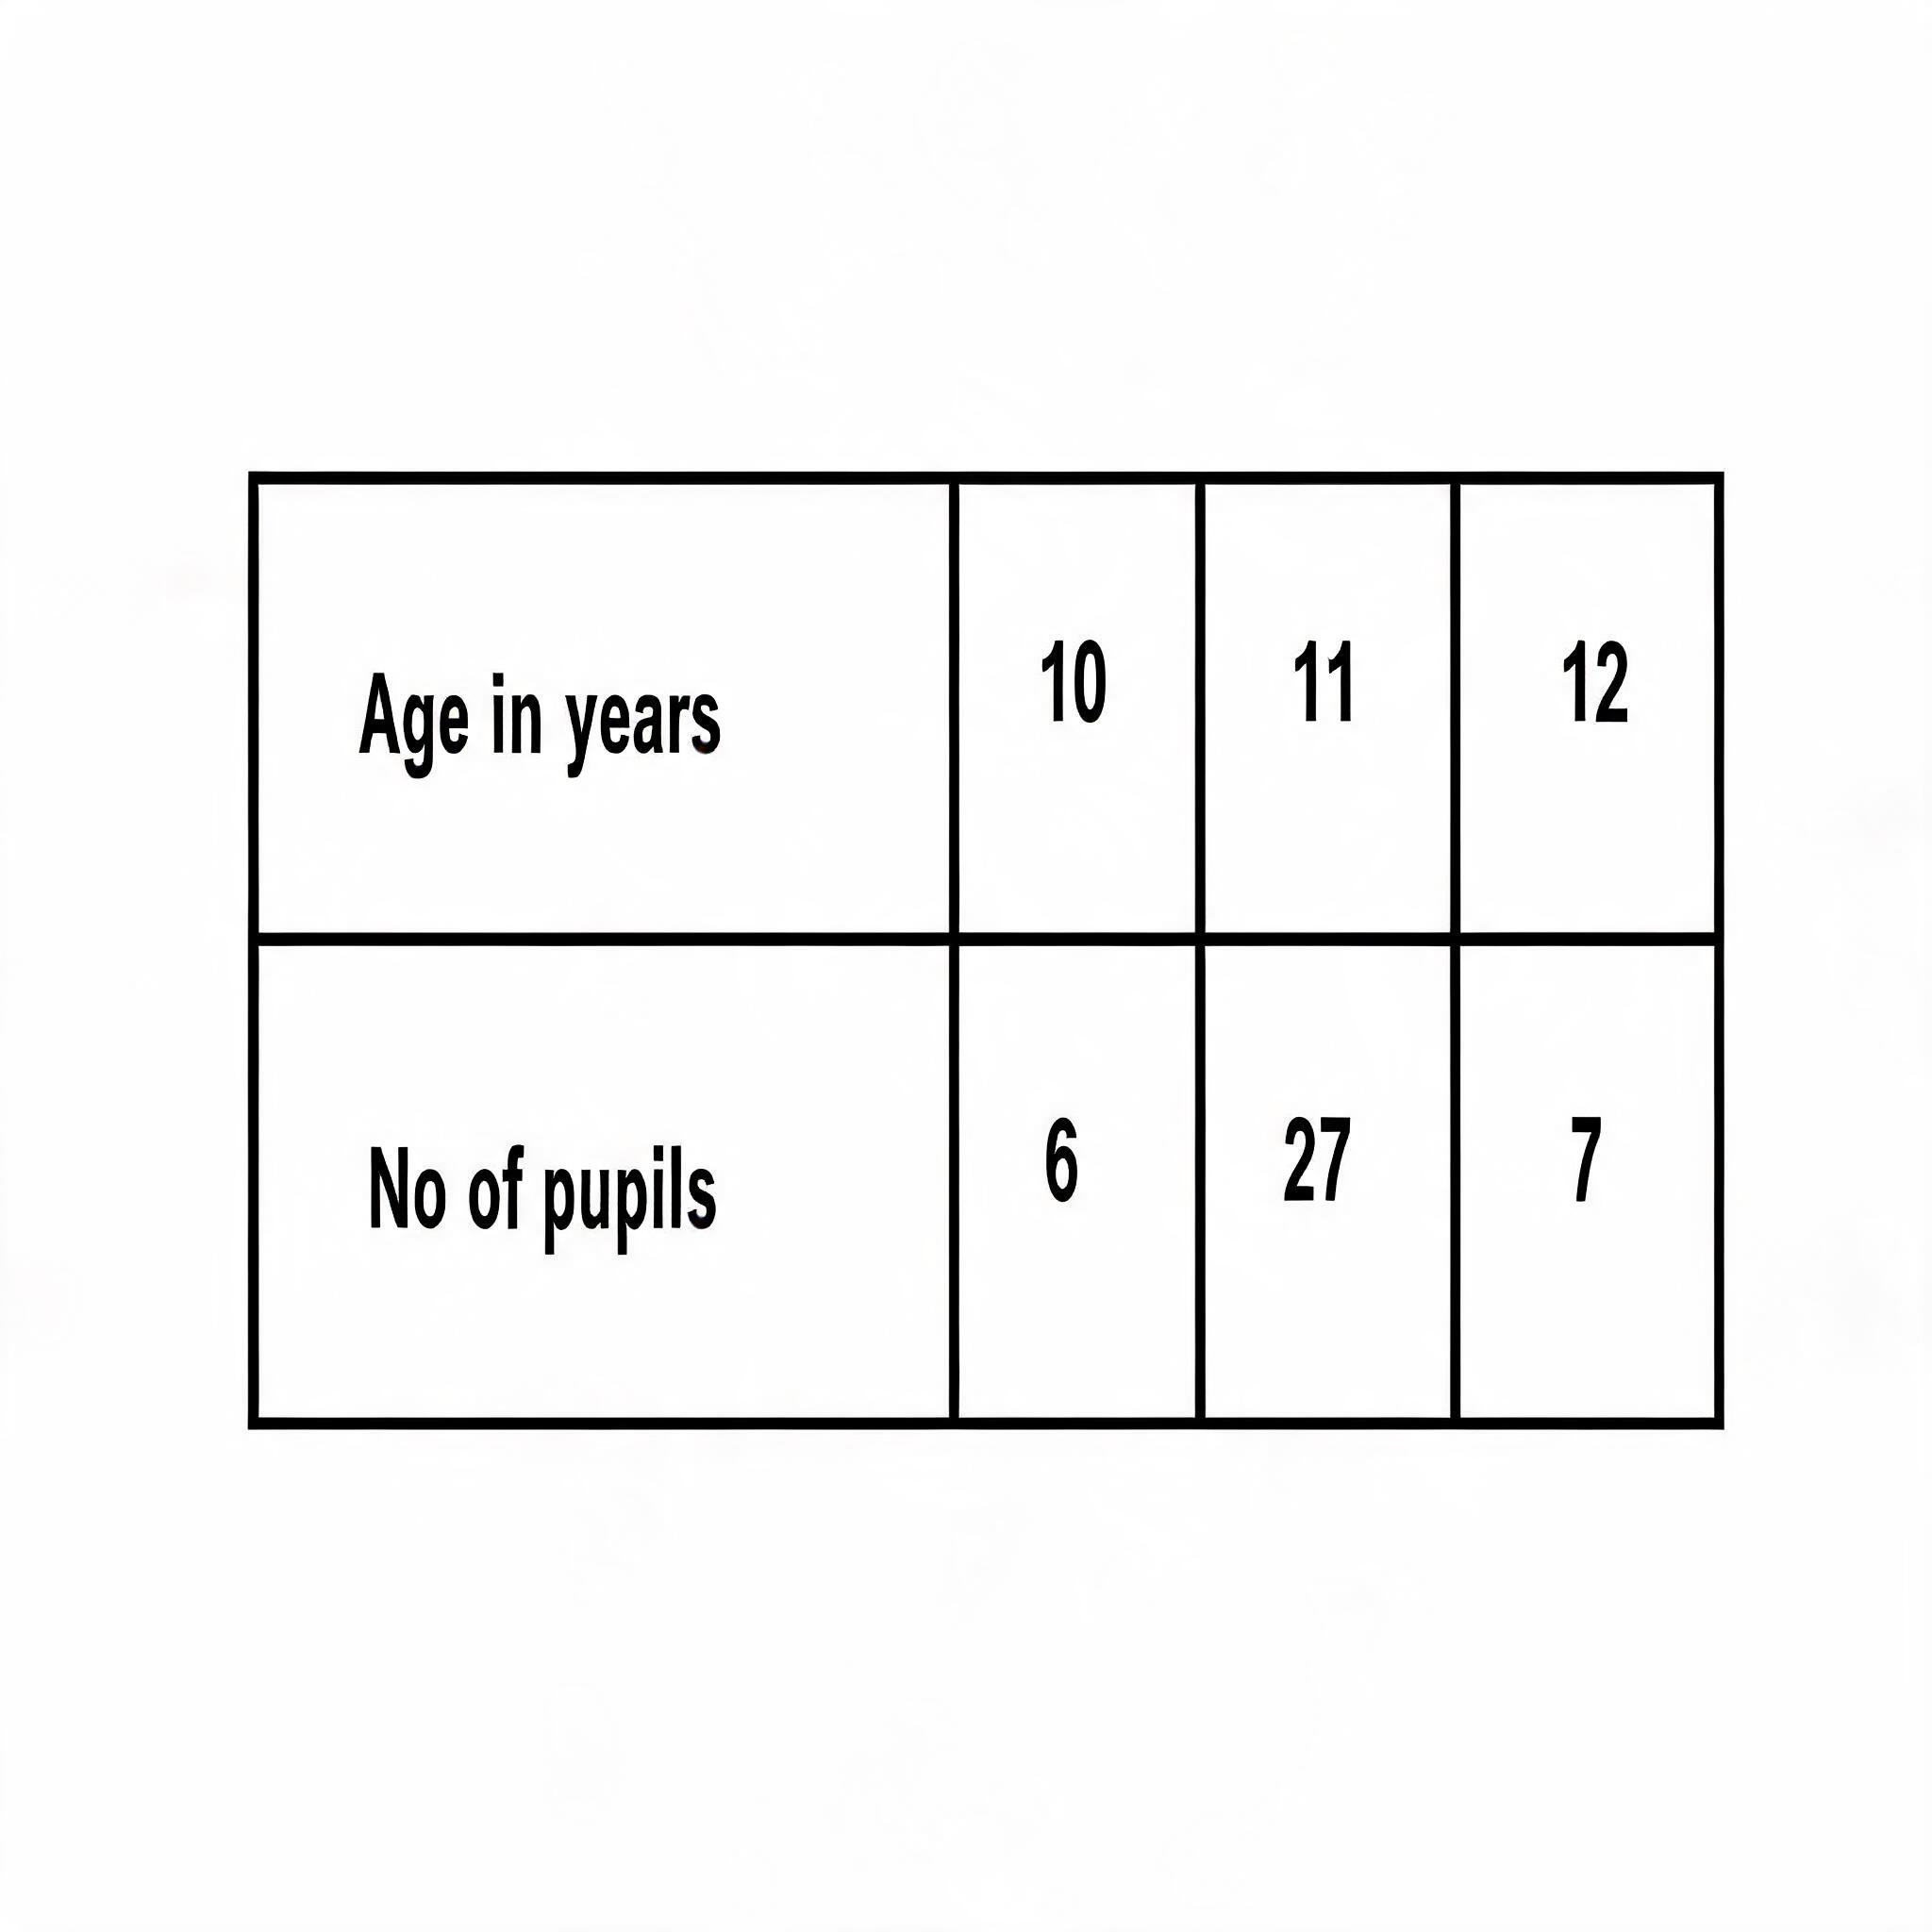
The table above shows the number of pupils in each age group in a class. What is the probability that a pupil chosen at random is at least 11 years old?
- A.
- B.
- C.
- D.
First, find the total number of pupils in the class by adding the numbers for each age group from the table: 6 + 27 + 7 = 40 pupils. The question asks for the probability of choosing a pupil who is 'at least 11 years old', which means 11 years old or older, so we add the number of pupils aged 11 and 12: 27 + 7 = 34 pupils. The probability is the number of pupils at least 11 years old divided by the total number of pupils, which is , and simplifying this fraction by dividing the top and bottom by 2 gives .
Common mistake: A common mistake is to only consider pupils who are exactly 11 years old , forgetting to include those who are 12 years old as they are also 'at least 11'.
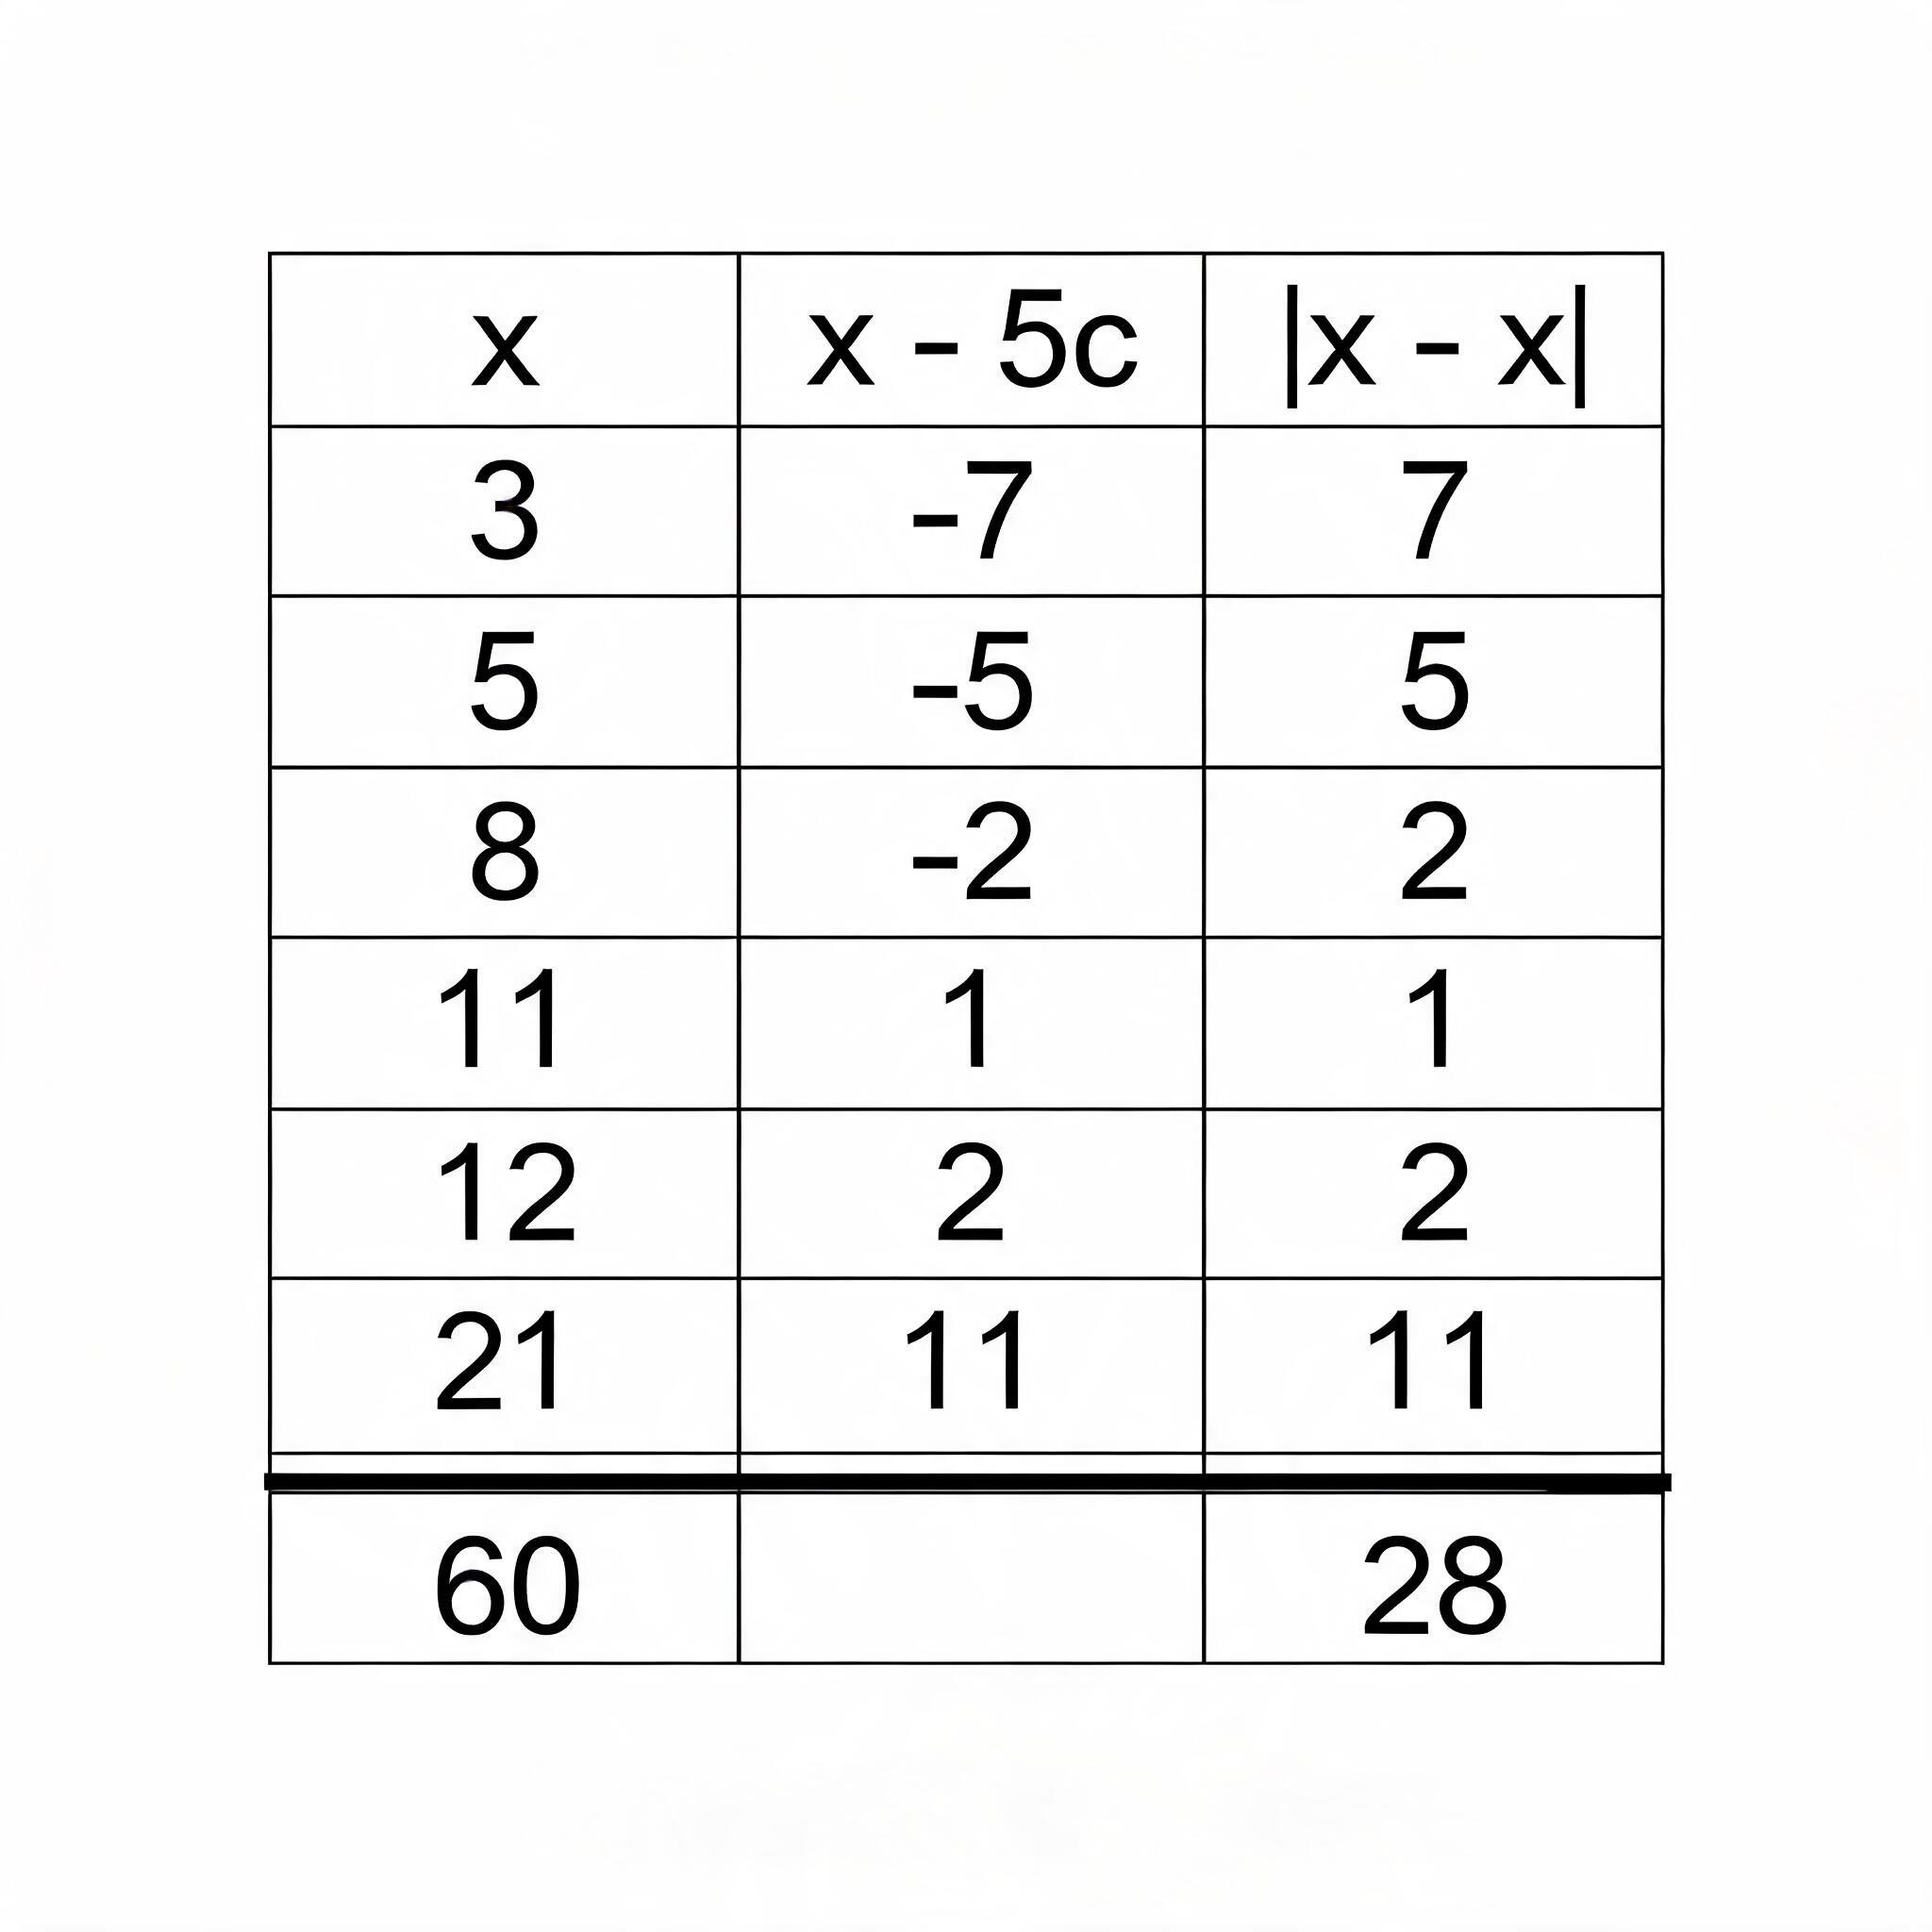
What is the mean deviation of 3, 5, 8, 11, 12 and 21?
- A.4.7
- B.60
- C.3.7
- D.10
To find the mean deviation, first calculate the mean (average) of the numbers. As shown in the table, the sum of the numbers (Σx) is 60, so the mean is 60 ÷ 6 = 10. Next, find the absolute difference between each number and the mean, which gives the values in the last column |x - x̄|: 7, 5, 2, 1, 2, 11. The sum of these absolute deviations (Σ|x - x̄|) is 28. Finally, the mean deviation is this sum divided by the number of values, which is 28 ÷ 6 ≈ 4.7.
Common mistake: A common mistake is to calculate the mean of the data, which is 10 (Option D), and incorrectly choose it as the mean deviation.
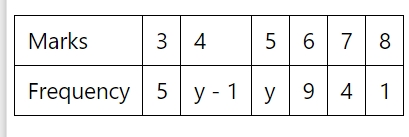
The table above gives the frequency distribution of marks obtained by a group of students in a test. If the total mark scored is 200, calculate the value of y
- A.15
- B.13
- C.11
- D.8
The total mark scored is calculated by summing the product of each mark and its corresponding frequency (Σfx). From the table, we form the equation: + (4×(y-1)) + (5×y) + + + = 200. This simplifies to 15 + 4y - 4 + 5y + 54 + 28 + 8 = 200. Combining like terms gives 9y + 101 = 200. Subtracting 101 from both sides, we get 9y = 99, and dividing by 9 gives y = 11.
Common mistake: A common mistake is to incorrectly expand the bracket 4(y-1) as 4y - 1 instead of 4y - 4, which leads to an incorrect final equation and answer.
10 C 6 = 10 ! ( 10 − 6 ) ! 6 ! = 10 ! 4 ! 6 ! = ( 10 × 9 × 8 × 7 × 6 ! ) 4 × 3 × 2 × 1 × 6 ! = 210 10 C 6 = 10 ! ( 10 − 6 ) ! 6 ! = 10 ! 4 ! 6 ! = ( 10 × 9 × 8 × 7 × 6 ! ) 4 × 3 × 2 × 1 × 6 ! = 210
In how many ways can 6 subjects be selected from 10 subjects for an examination
- A.218
- B.216
- C.215
- D.210
This problem is about selecting a group of items where the order of selection does not matter, so we use the combination formula. We need to find the number of ways to choose 6 subjects from 10, which is written as 10C6. The formula is 10! / , which simplifies to / , giving a final answer of 210.
Common mistake: Students often confuse this with a permutation problem, where the order of selection would matter, but here we are only concerned with the group of subjects selected, not the arrangement.
SOLUTION: ∫ x 2 − x x = ∫ x 2 x − x 1 2 x ∫ x − x − 1 2 = ( 1 2 ) x 2 − x 1 2 1 2 + K = x 2 2 − 2 x 1 2 + K = x 2 2 − 2 x + K
Integrate with respect to x
- A.
- B.
- C.
- D.
First, simplify the expression by dividing each term in the numerator by x. This gives dx, which simplifies to ∫(x - x⁻¹/²) dx. Next, integrate each term using the power rule: the integral of x is x²/2, and the integral of x⁻¹/² is x¹/² divided by , which equals 2x¹/² or . Combining these results and adding the constant of integration, K, gives the final answer x²/2 - + K.
Common mistake: A common mistake is incorrectly integrating the second term , forgetting to divide by the new power of , which leads to the incorrect answer in option C.
See all 49 JAMB Mathematics 2007 questions
Sign up free to unlock every question in this paper — with the verified answer and Beta's worked explanation on each one. No card needed to begin.
Start free