JAMB Economics 2022 Past Questions & Answers
83 JAMB Economics 2022 questions with verified answers and worked explanations. Here are the first 25 — sign up free to practise the full paper.
Marginal cost is?
- A.the lowest cost of producing goods
- B.the cost of production of the most efficient firm in an industry
- C.the cost of production of the most inefficient firm in an industry
- D.the cost of production of the last or extra unit of goods produced by a firm
Marginal cost is defined as the additional cost incurred by a firm when it produces one more unit of a good or service. It helps businesses make decisions about increasing or decreasing production. Option D correctly captures this definition as the cost of producing the last or extra unit.
Common mistake: Students often confuse marginal cost with average cost or total cost, or misinterpret it as the lowest cost of production, leading them to choose options like A.
The price mechanism
- A.regulates supply and demand
- B.rations the consumers
- C.rewards the producers
- D.allocates scarce resources
- E.does all of the above
The price mechanism refers to the system where prices are set by the interaction of supply and demand in a market. It acts as a regulator, adjusting prices until the quantity supplied matches the quantity demanded, thereby bringing the market to equilibrium. This process ensures that resources are allocated efficiently based on consumer preferences and producer costs.
Common mistake: Students might choose option D, 'allocates scarce resources,' because this is a significant outcome of the price mechanism, but option A describes the fundamental process by which it achieves that allocation.
In a free market economy, the rationing of scarce goods is done principally by?
- A.the government
- B.business organizations
- C.the price mechanism
- D.consumers
In a free market economy, the price mechanism is the principal way scarce goods are rationed. This mechanism involves the interaction of supply and demand, where prices adjust to allocate goods to those consumers who are willing and able to pay for them. When goods are scarce, their prices rise, which naturally limits demand and ensures the available supply goes to its most valued uses.
Common mistake: Students might incorrectly choose 'the government' if they confuse a free market economy with a command economy, where the government plays the central role in resource allocation and rationing.
Scale of preference shows
- A.incomes of consumers in order of size
- B.utilities enjoyed by consumers
- C.opportunity cost of goods consumed
- D.consumer's wants in order of priority
A scale of preference is a fundamental tool in economics used to illustrate the concept of choice. It is a list of a person's wants arranged in order of importance or priority. Because resources are scarce and cannot satisfy all wants, individuals must rank their needs and desires to decide which ones to fulfill first, which is exactly what a scale of preference shows.
Common mistake: Students may mistakenly choose option C because opportunity cost is determined from the scale of preference (it's the next best alternative you give up), but the scale itself is simply the list of wants in order of priority.
There is unemployment of resources when production is
- A.within the production possibility curve
- B.outside the production possibility curve
- C.along the production possibility curve
- D.adequate to meet market demand
The Production Possibility Curve (PPC) illustrates the maximum output an economy can produce with its available resources and technology. If production is within the PPC, it means the economy is not fully utilizing its resources, leading to unemployment or underemployment. This indicates inefficiency and a failure to reach potential output.
Common mistake: Students often confuse 'within the PPC' with 'along the PPC'. 'Along the PPC' (Option C) signifies full employment and efficient resource allocation, while 'within the PPC' indicates unemployment or underutilization of resources.
A major characteristic of natural resources is they
- A.are unlimited in supply
- B.have high cost of production
- C.are free gifts of nature
- D.do not command any price
Natural resources, often categorized as 'land' in economics, are fundamentally considered 'free gifts of nature' because they are not created by human effort but are naturally occurring. This characteristic distinguishes them from other factors of production like labour and capital. Although their extraction and utilization may involve costs, their inherent existence is a natural endowment.
Common mistake: Students might incorrectly choose option A, 'are unlimited in supply', confusing natural abundance with economic scarcity, or option D, 'do not command any price', overlooking the concept of rent for natural resources.
A major disadvantage of a capitalist economy is that it
- A.leads to low production of goods and services
- B.requires large number of officials to operate
- C.considers individual consumers' satisfaction
- D.worsens income inequality among the citizens
A capitalist economy, also known as a free market economy, is driven by private ownership and the pursuit of profit. A major criticism of this system is that it can lead to a wide gap between the rich and the poor. Those who own capital can accumulate vast wealth, while workers may struggle, which worsens income inequality in the society.
Common mistake: Students might mistakenly choose option C because consumer satisfaction is a feature of capitalism, but they forget that the question asks for a *disadvantage*, and consumer satisfaction is considered an advantage.
The mining sector of an economy contributes 60% to the Gross Domestic Product(GDP). If the GDP is $540, what is the contribution of the mining sector?
- A.$ 90.00
- B.$ 180.00
- C.$ 324.00
- D.$ 350.00
The question asks to calculate a specific sector's contribution to the Gross Domestic Product (GDP), which is a key measure of national income. To find the contribution, you multiply the total GDP by the percentage contributed by the mining sector. So, 60% of $540 is 0.60 * $540, which equals $324.00.
Common mistake: Students might make calculation errors, such as dividing $540 by 60 instead of multiplying by 0.60, leading to an incorrect answer.
The increase in the demand for a commodity may lead to a decrease in the demand for another if both are
- A.in complementary demand
- B.of the same quality
- C.in composite demand
- D.in competitive demand
Goods in competitive demand are also known as substitutes, which means they can be used in place of each other to satisfy the same want (e.g., Milo and Bournvita). If consumers start demanding more of one product, like Milo, they will naturally buy less of its competitor, Bournvita. This is because they have switched from one brand to the other, causing the demand for the second commodity to fall.
Common mistake: Students often mistakenly choose 'complementary demand' because it's another type of demand relationship, but they forget that complements are used together (like cars and petrol), so an increase in demand for one would *increase* the demand for the other.
The demand curve for goods of ostentation is usually
- A.negatively sloped
- B.positively sloped
- C.vertical
- D.horizontal
Goods of ostentation, also known as Veblen or luxury goods, are items people buy to display their wealth and social status. For these goods, a higher price makes them more exclusive and desirable, causing people to demand more as the price rises. This positive relationship between price and quantity demanded creates a demand curve that slopes upwards from left to right, which is described as being positively sloped.
Common mistake: Students often mistakenly choose the negatively sloped curve because they apply the general law of demand without considering that goods of ostentation are a specific exception to this rule.
PN equals average revenue or marginal revenue cure of
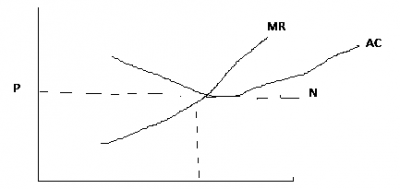
- A.An imperfect competitive firm
- B.a monopoly
- C.a perfectly competitive firm
- D.a monopolistic competitive firm
In a perfectly competitive market, an individual firm is a 'price taker', meaning it has no power to influence the market price and must sell at the prevailing rate. Because the price is constant for every unit sold, the additional revenue from selling one more unit (Marginal Revenue) is equal to the price. Likewise, the Average Revenue (Total Revenue ÷ Quantity) is also equal to the price, which means Price = Average Revenue = Marginal Revenue (P=AR=MR).
Common mistake: Students often mistakenly choose monopoly or monopolistic competition, but for these firms, they must lower their price to sell more units, which causes their marginal revenue to be less than their average revenue (price).
If the quantity demanded of a commodity increases from 20 units to 30 units when there is an increase in price from $4.00 to $5.00, the elasticity of demand is
- A.0.50
- B.0.65
- C.2.00
- D.2.50
Price Elasticity of Demand (PED) measures how much the quantity demanded responds to a change in price. It is calculated as the percentage change in quantity demanded divided by the percentage change in price. The percentage change in quantity demanded is * 100 = 50%. The percentage change in price is (($5-$4)/$4) * 100 = 25%. Therefore, PED = 50% / 25% = 2.00.
Common mistake: A common mistake is to use the new price ($5) as the base for calculating the percentage change in price, which would incorrectly lead to an answer of 2.50 (Option D).
The supply curve of a locally-produced good may shift to the right if
- A.there is an increase in taxes on inputs
- B.government increases subsidies
- C.rural-urban migration is encouraged
- D.the price of the commodity increases
An increase in government subsidies reduces the cost of production for firms. When production costs decrease, producers are encouraged to supply more goods at every given price. This increase in supply is graphically represented by a shift of the supply curve to the right.
Common mistake: Students often confuse a shift in the supply curve with a movement along the supply curve. Option D describes a movement along the curve due to a price change, not a shift caused by non-price factors.
In perfectly elastic supply, the supply curve
- A.is vertical
- B.is horizontal
- C.slopes upward
- D.slopes downward
Perfectly elastic supply means that producers are willing to supply an infinite quantity of a good at a specific price, but nothing at a slightly lower price. This implies that the supply curve is a horizontal line at that particular price level. Any change in price, no matter how small, leads to an infinite change in quantity supplied, hence the horizontal shape.
Common mistake: Students often confuse perfectly elastic supply with perfectly inelastic supply, which is represented by a vertical supply curve because the quantity supplied does not change regardless of price.
A country's budget allocation to various sectors of the economy is shown in the pie chart above... Use it to answer this question. If the budget of the country was $7,200, how much is allocated to Education?
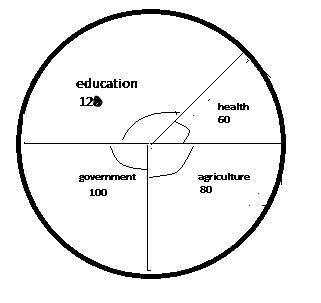
- A.$2,400.00
- B.$2,000.00
- C.$1,200.00
- D.$1,000.00
The question asks about a country's budget allocation to various sectors, which is a core aspect of public finance. Fiscal policy involves government decisions on spending and taxation to influence the economy. Calculating the amount allocated to a specific sector from the total budget directly relates to understanding government expenditure.
Common mistake: Students might misinterpret the proportion for Education from the pie chart or make arithmetic errors during calculation, leading them to select an incorrect option like C if they mistakenly assume a different percentage.
A country's budget allocation to various sectors of the economy is shown in the pie chart above... Use it to answer this question What is the ratio of expenditure on health to Agriculture if the yearly budget is 7200?
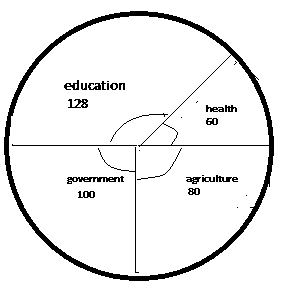
- A.2: 3
- B.3:4
- C.4:3
- D.5:4
The question requires you to interpret data from a pie chart, which is a graphical tool for economic analysis. To find the ratio of expenditure, you simply use the ratio of the degrees allocated to each sector. The ratio of Health (60°) to Agriculture (80°) is 60:80. Simplifying this by dividing both sides by their greatest common divisor, 20, gives a final ratio of 3:4.
Common mistake: Students might mistakenly calculate the ratio of Agriculture to Health (80:60) instead of Health to Agriculture (60:80), which would lead to the incorrect answer of 4:3.
A consumer of a single commodity is in equilibrium when
- A.he can equate his demand with price
- B.he equates marginal utility and price
- C.he can equate his marginal and total utilities
- D.his marginal utility is equal to zero
A consumer of a single commodity reaches equilibrium when the marginal utility (additional satisfaction) derived from consuming the last unit of the good is equal to its price. This condition, known as MUx = Px, ensures the consumer is maximizing their satisfaction given the price of the commodity. If marginal utility were greater than the price, the consumer would buy more, and if it were less, they would buy less.
Common mistake: Students might incorrectly choose option C, equating marginal and total utilities, but these are distinct concepts and not equated for consumer equilibrium.
If the government imposes a minimum price on a commodity
- A.market surplus occurs
- B.the market will be cleared in the short-run
- C.excess demand occurs
- D.government regulation is no longer needed
When the government imposes a minimum price (also known as a price floor) on a commodity, it sets a price above the natural market equilibrium. At this higher price, producers are willing to supply more of the commodity, but consumers are willing to buy less. This imbalance leads to a situation where the quantity supplied exceeds the quantity demanded, resulting in a market surplus.
Common mistake: Students often confuse minimum price (price floor) with maximum price (price ceiling), leading them to incorrectly choose 'excess demand occurs' (which is a result of a price ceiling).
A minimum price legislation is also called
- A.price ceiling
- B.price floor
- C.price control
- D.price mechanism
A minimum price legislation is a government-imposed price control that sets the lowest price a seller can charge for a product or service. This is also called a price floor because it establishes a 'floor' or a base below which the price cannot legally fall. This is often done to protect producers, for example, the national minimum wage protects workers by setting a minimum price for their labour.
Common mistake: Students often confuse a minimum price with a 'price ceiling', but a price ceiling is the opposite; it is a maximum price set by the government.
Which of the following factors is not a cause of diminishing returns?
- A.Increase in variable inputs
- B.Land fragmentation
- C.Constant technology
- D.Technological innovations
The law of diminishing returns describes a situation where adding more of a variable input (like labour) to a fixed input (like land) eventually leads to a smaller increase in output. This law assumes that the state of technology is constant. Technological innovations, such as new machines or better farming methods, improve productivity and would therefore prevent or postpone diminishing returns, not cause them.
Common mistake: Students may mistakenly choose 'Constant technology' because it seems passive, but the law of diminishing returns specifically assumes that technology does not change for the law to hold true.
In manufacturing, division of labour may be hindered by
- A.excessive demand for the product
- B.low level of technology
- C.excess supply of labour
- D.increase in the export of goods
Division of labour is the process of breaking down a production process into smaller, specialized tasks for different workers. For this to be effective, especially in manufacturing, specific tools and machinery are needed for each specialized task. A low level of technology means these machines are not available, which makes it difficult to break down the work and therefore hinders division of labour.
Common mistake: Students might mistakenly choose 'excess supply of labour' (C), thinking that having too many workers makes organization difficult, but the real barrier to specialization is the lack of appropriate tools and machinery.
The production cost that varies inversely with output is the
- A.total fixed cost
- B.marginal cost
- C.average fixed cost
- D.average cost
Average cost (AC) is the total cost divided by the quantity produced. As output increases, especially in the initial stages of production, the fixed costs are spread over a larger number of units. This spreading of fixed costs, combined with potential economies of scale, leads to a reduction in the average cost per unit, thus showing an inverse relationship with output.
Common mistake: Many students might incorrectly choose Average Fixed Cost (C) because it consistently decreases as output rises, but Average Cost (D) is a broader measure that also shows this inverse trend due to the influence of fixed costs and economies of scale.
A firm that closes down will still incur
- A.variable cost
- B.fixed cost
- C.total cost
- D.marginal cost
Fixed costs are expenses that do not change with the level of production, such as rent, insurance, or salaries of administrative staff. Even if a firm temporarily closes down and produces zero output, it must still pay these costs to maintain its capital and be ready to operate again. In contrast, variable costs, like the cost of raw materials, fall to zero when production stops.
Common mistake: Students may mistakenly choose 'total cost' because it includes fixed cost, but this is incorrect as the variable cost component of total cost becomes zero when the firm shuts down.
The sufficient condition for a firm to be in equilibrium is that the
- A.firm must show that it is profitable
- B.marginal cost must be equal to average revenue
- C.marginal revenue curve is above the average revenue curve
- D.marginal cost curve cuts the marginal revenue curve from below
A firm is in equilibrium when it maximizes its profit. For this to happen, two conditions must be met. The first (necessary) condition is that Marginal Cost (MC) equals Marginal Revenue (MR). The second (sufficient) condition is that the MC curve must cut the MR curve from below, which ensures that profits are maximized at that output level and not minimized.
Common mistake: Students often remember the first condition (MC = MR) but forget the second, or they confuse Marginal Revenue (MR) with Average Revenue (AR), making option B a tempting but incorrect choice.
Cooperative societies are formed mainly to
- A.assist producers to maximize their profits
- B.encourage thrift and credit among members
- C.promote and maintain the welfare of members
- D.break the monopolies of private companies
A cooperative society is a type of business organization owned and run by its members to meet their common needs. The fundamental goal is to serve the members themselves, not to make a profit for outside investors. Therefore, their main purpose is to promote and maintain the welfare of the members, whether by providing goods at lower prices, offering loans, or marketing their products together.
Common mistake: Students may mistakenly choose option B because credit and thrift societies are a very common type of cooperative, but this is a specific function and not the main purpose of all cooperatives in general.
See all 83 JAMB Economics 2022 questions
Sign up free to unlock every question in this paper — with the verified answer and Beta's worked explanation on each one. No card needed to begin.
Start free